Maths Challenges

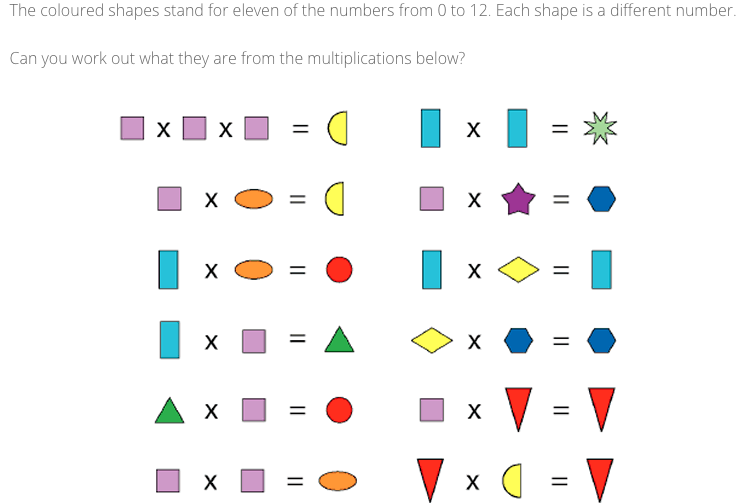 Well done to Dev, Melina, Yasmin and Mia for the correct solution.
0 Comments
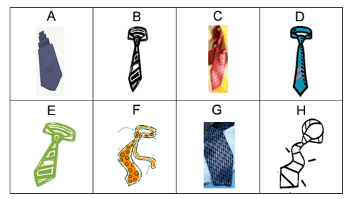 Kaia's father always wore a white shirt and coloured tie for work. He didn't like deciding which tie to wear so he would put his hand in the drawer and wear the first tie that he pulled out. Each evening the tie would go back in the drawer. One Friday morning, Kaia said, "Do you like that tie? You usually wear it at least twice a week." "I do not," replied her father, "I have eight ties and I only work five days a week. I certainly don't wear any tie more than once a week." "You have worn that tie twice a week in at least five of the ten weeks you have been taking me to school," Kaia insisted. "Impossible! Prove it!" challenged her father. Do you think Kaia or her father was right? Why? That weekend Kaia did an experiment. She made the following drawings of his ties and created the chart shown below. 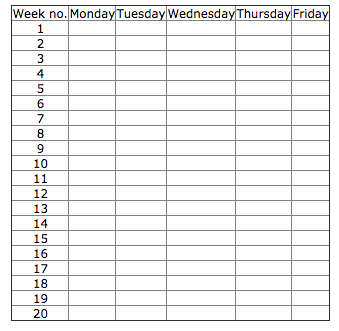 How might Kaia use the drawings and chart to prove her father wrong?
Try doing an experiment yourself to find out which ties might be chosen. What did the result of your experiment show? 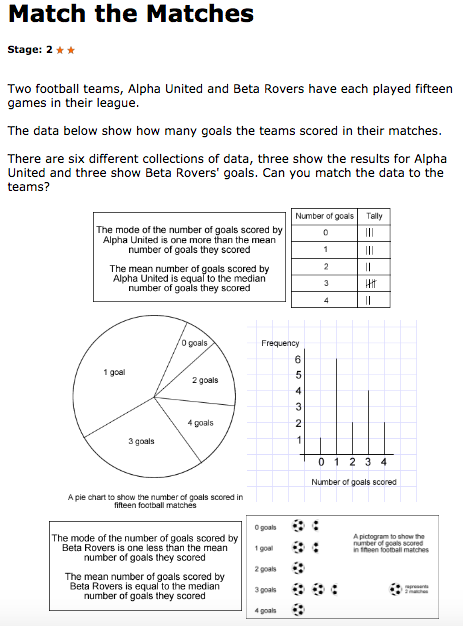 Well done to Kai, Yasmin, Dev and Milena for getting this correct. A special mention to William and Chase for having a go.. The answer was:
Pie Chart and Bar Graph belong to Alpha Pictogram and Tally Chart belong to Beta   Well done to Yasmin, Mia and Milena for getting the correct answers to this one.
Here are some of the answers: |
AuthorWrite something about yourself. No need to be fancy, just an overview. Archives
May 2017
Categories |

 RSS Feed
